Simulating random meetings (Areas of Knowledge with preferences)
The basic idea is that when two agents meet, they learn together. Later, this should happen in a network. In the beginning, I will let the agents meet randomly in the population to see if the implementation of joint learning works.
If it works as it should, it will be expanded so that a certain percentage of the population meets at the same time.
Now it seems to be time to add other aspects. At first it seems central that different areas of knowledge should be possible.
Up to now, the topic has been defined in terms of knowledge; now it should be a question of preference.
Definitions
Loading some Packages for easier Data management and Presentation of Results
sort_Pop<-function(Pop=Pop,sort_Par=TRUE,clean_Par=FALSE,sort_Agents=NA){if(sort_Par==TRUE){Pop<-Pop%>%select(tidyselect::all_of(sort_Colnames(Pop =Pop, name ="ID")),tidyselect::all_of(sort_Colnames(Pop =Pop, name ="Agents")),tidyselect::all_of(sort_Colnames(Pop =Pop, name ="Learnrate")),tidyselect::all_of(sort_Colnames(Pop =Pop, name ="Knowledge")),tidyselect::all_of(sort_Colnames(Pop =Pop, name ="Counter")),tidyselect::all_of(sort_Colnames(Pop =Pop, name ="Resources")),everything())}if(clean_Par==TRUE){Pop<-Pop%>%select(tidyselect::all_of(sort_Colnames(Pop =Pop, name ="ID")),tidyselect::all_of(sort_Colnames(Pop =Pop, name ="Agents")),tidyselect::all_of(sort_Colnames(Pop =Pop, name ="Learnrate")),tidyselect::all_of(sort_Colnames(Pop =Pop, name ="Knowledge")),tidyselect::all_of(sort_Colnames(Pop =Pop, name ="Counter")))}if(!is.na(sort_Agents)){Pop<-Pop%>%arrange(across(all_of(sort_Agents)))}return(Pop)}
update_Topic<-function(Pop=Pop,sort_Par=TRUE,clean_Par=FALSE,sort_Agents=NA){Typs<-get_Typ(Pop =Pop, name ="Knowledge")Pop_long<-longer_Pop(Pop =Pop, name ="Knowledge")Pop_long<-Pop_long%>%group_by(ID)%>%mutate(tmp_Rank =rank(Knowledge, ties.method ="random"), tmp_Rank =max(tmp_Rank)-tmp_Rank+1, tmp_Rank =0.5^tmp_Rank, ID_Topic =case_when(ID_Preference%in%Typs~ID_Preference,ID_Preference=="All"~Typ[which.min(tmp_Rank)],TRUE~Typ[which.max(Knowledge)]))%>%ungroup()Pop_long<-del_tmp(Pop =Pop_long)Pop<-wider_Pop(Pop_long =Pop_long, name ="Knowledge")Pop<-sort_Pop(Pop =Pop, sort_Par =sort_Par, clean_Par =clean_Par, sort_Agents =sort_Agents)return(Pop)}
Generate grouped Population
Code
gen_Pop<-function(addToPop=NULL,nA=NumberOfAgents,ID_Preference="Max",ID_University=ID_University,K=Knowledge,Typ=SpezKnowledge,pWD=percentsWorkingaDay,pMD=percentsMeetingsaDay){ID<-seq_len(nA)Pop<-tibble(ID =ID, ID_Preference =ID_Preference, ID_University =ID_University)Pop<-update_Typ(Pop =Pop, name ="Agents", Typ =list("p_WorkDay", "p_MeetDay"), add =list(pWD, pMD), set =TRUE)Pop<-update_Typ(Pop =Pop, name ="Knowledge", Typ =Typ, add =K, set =TRUE)if(!is.null(addToPop)){Pop<-Pop%>%mutate(ID =ID+max(addToPop$ID))Typ_add<-get_Typ(Pop =addToPop, name ="Knowledge")Pop<-update_Typ(Pop =Pop, name ="Knowledge", Typ =Typ_add, add =0)addToPop<-update_Typ(Pop =addToPop, name ="Knowledge", Typ =Typ, add =0)Pop<-bind_rows(addToPop,Pop)}Pop<-update_Learnrate(Pop =Pop)Pop<-update_Topic(Pop =Pop)Pop<-sort_Pop(Pop =Pop)return(Pop)}
Code
Pop<-gen_Pop( nA =3, ID_Preference ="Max", ID_University ="Zürich", K =list(0.01, 0.2), Typ =list("M1", "M2"), pWD =0.5, pMD =0.8)Pop<-gen_Pop( addToPop =Pop, nA =2, ID_Preference ="All", ID_University ="Bern", K =list(0.01, 0.2), Typ =list("M3", "M2"), pWD =0.2, pMD =0.5)Pop<-gen_Pop( addToPop =Pop, nA =1, ID_Preference ="M3", ID_University ="Bern", K =list(0.8), Typ =list("M1"), pWD =0.2, pMD =0.5)Pop<-gen_Pop( addToPop =Pop, nA =1, ID_Preference ="M1", ID_University ="Bern", K =list(0.3, 0.3, 0.3), Typ =list("M1", "M2", "M3"), pWD =0.2, pMD =0.5)Pop<-gen_Pop( addToPop =Pop, nA =1, ID_University ="Bern", K =list(0.0, 0.0, 0.0), Typ =list("M1", "M2", "M3"), pWD =0.2, pMD =0.5)Pop
# A tibble: 8 × 13
     ID ID_Preference ID_Topic ID_University Agents_Knowledge_Max
  <int> <chr>         <chr>    <chr>                        <dbl>
1     1 Max           M2       Zürich                         0.2
2     2 Max           M2       Zürich                         0.2
3     3 Max           M2       Zürich                         0.2
4     4 All           M1       Bern                           0.2
5     5 All           M1       Bern                           0.2
6     6 M3            M3       Bern                           0.8
7     7 M1            M1       Bern                           0.3
8     8 Max           M1       Bern                           0
# ℹ 8 more variables: Agents_Knowledge_Profile <dbl>, Agents_p_MeetDay <dbl>,
#   Agents_p_WorkDay <dbl>, Learnrate_Others <dbl>, Learnrate_Topic <dbl>,
#   Knowledge_M1 <dbl>, Knowledge_M2 <dbl>, Knowledge_M3 <dbl>
Simulation parameter
reset_Counter
Code
reset_Counter<-function(Pop=Pop){Pop<-update_Typ(Pop =Pop, name ="Counter", Typ =list("Day", "Time_total","Time_meet","Time_learnd","Number_meet"), add =0, set =TRUE)return(Pop)}
update_Resources
Code
update_Resources<-function(Pop=Pop,time_day=hoursDay,set=TRUE){tmp_Time<-time_day*Pop[["Agents_p_WorkDay"]]tmp_p<-Pop[["Agents_p_MeetDay"]]Pop<-update_Typ(Pop =Pop, name ="Resources", Typ =list("Time_total","Time_meet","Time_learnd"), add =list(tmp_Time,tmp_Time*tmp_p,tmp_Time*(1-tmp_p)), set =set)return(Pop)}
sel_Pairs_rnd<-function(Pop=Pop,psize=percentsOfPop){psize<-min(psize, 1)nR<-nrow(Pop)n<-round(nR*psize*0.4999, 0)n<-max(n, 1)SubPop<-sel_SubPop( Pop =Pop, n =n)Slot1<-SubPop$sel%>%mutate(tmp_ID =seq_len(n))if(nrow(SubPop$rest)==n){Slot2<-SubPop$rest}else{SubPop<-sel_SubPop( Pop =SubPop$rest, n =n)Slot2<-SubPop$sel}Slot2<-Slot2%>%mutate(tmp_ID =seq_len(n))Pairs<-bind_rows(Slot1, Slot2)return(Pairs)}
Timeline<-get_Timeline(TL =Timeline, Pop =Pop)Pop1<-update_Pop(Pop =Pop, name ="Counter_Day", add =1)Timeline<-get_Timeline(TL =Timeline, Pop =Pop1)Timeline
# A tibble: 16 × 18
      ID ID_Preference ID_Topic ID_University Agents_Knowledge_Max
   <int> <chr>         <chr>    <chr>                        <dbl>
 1     1 Max           M1       Zürich                      0.116
 2     2 Max           M1       Zürich                      0.101
 3     3 Max           M2       Zürich                      0.241
 4     4 All           M3       Bern                        0.2
 5     5 All           M3       Bern                        0.2
 6     6 M3            M3       Bern                        0.800
 7     7 M1            M1       Bern                        0.376
 8     8 Max           M1       Bern                        0.0368
 9     1 Max           M1       Zürich                      0.116
10     2 Max           M1       Zürich                      0.101
11     3 Max           M2       Zürich                      0.241
12     4 All           M3       Bern                        0.2
13     5 All           M3       Bern                        0.2
14     6 M3            M3       Bern                        0.800
15     7 M1            M1       Bern                        0.376
16     8 Max           M1       Bern                        0.0368
# ℹ 13 more variables: Agents_Knowledge_Profile <dbl>, Agents_p_MeetDay <dbl>,
#   Agents_p_WorkDay <dbl>, Learnrate_Others <dbl>, Learnrate_Topic <dbl>,
#   Knowledge_M1 <dbl>, Knowledge_M2 <dbl>, Knowledge_M3 <dbl>,
#   Counter_Day <dbl>, Counter_Number_meet <dbl>, Counter_Time_learnd <dbl>,
#   Counter_Time_meet <dbl>, Counter_Time_total <dbl>
A learning process with updated learn rate by current knowledge when Agents meet randomly by Days
Code
sim_Days<-function(Pop=Pop,nD=nubmberDay,time_day=8,time_meet=0.75){Pop<-update_Learnrate(Pop =Pop)Pop<-update_Topic(Pop =Pop)Pop<-reset_Counter( Pop =Pop)Pop<-update_Resources( Pop =Pop, time_day =time_day)TL<-get_Timeline(TL =TL, Pop =Pop)for(iin1:nD){Pop<-learn_Day(Pop =Pop, time_day =time_day, time_meet =time_meet)Pop<-update_Typ(Pop =Pop, name ="Counter", Typ =list("Day"), add =list(i), set =TRUE)TL<-get_Timeline(TL =TL, Pop =Pop)}Output<-list( Pop =Pop, TL =TL)return(Output)}
Definition & Calculation
Code
Pop<-gen_Pop( nA =30, ID_Preference ="M1", ID_University ="Zürich", K =list(0.01), Typ =list("M1"), pWD =0.8, pMD =0.8)Pop<-gen_Pop( addToPop =Pop, nA =30, ID_Preference ="All", ID_University ="Bern", K =list(0.01), Typ =list("M2"), pWD =0.8, pMD =0.8)Pop
plt_Number_meet(TL =res$TL, TP =0, Group ="ID_University")
Code
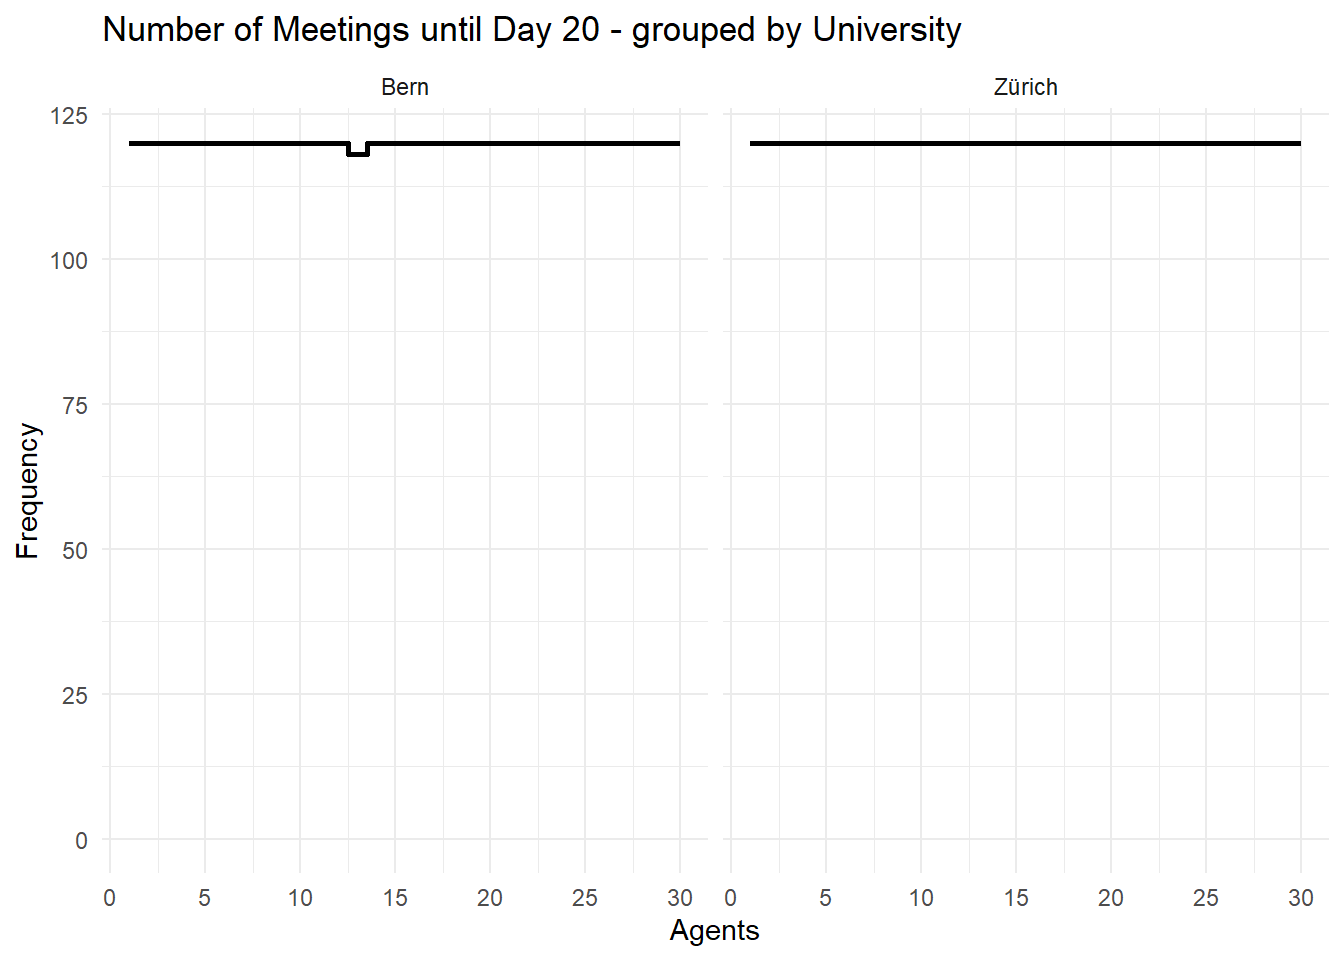
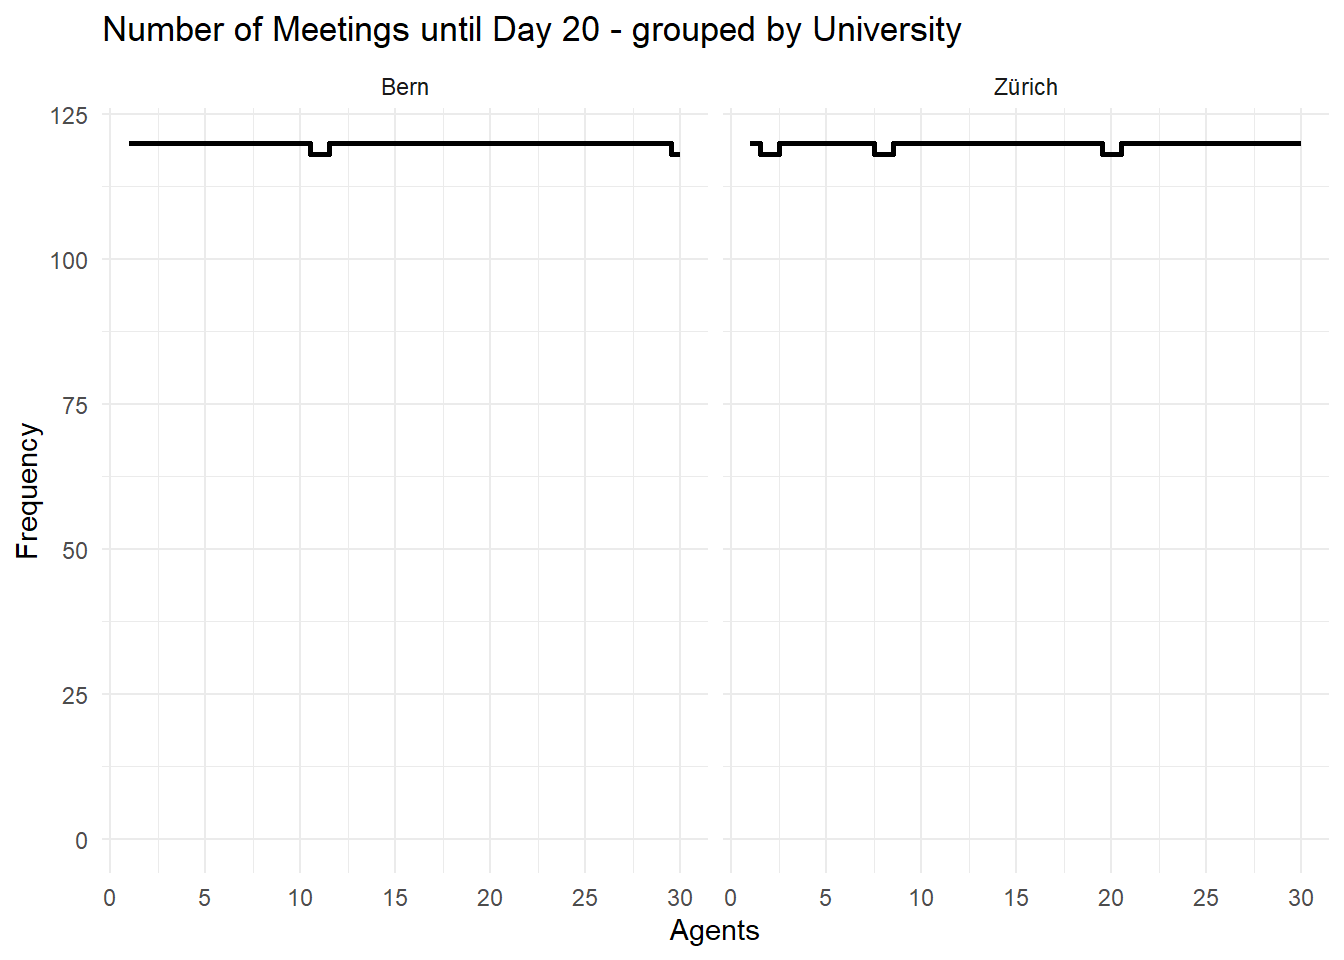
plt_Number_meet(TL =res$TL, TP =20, Group ="ID_University")
Code
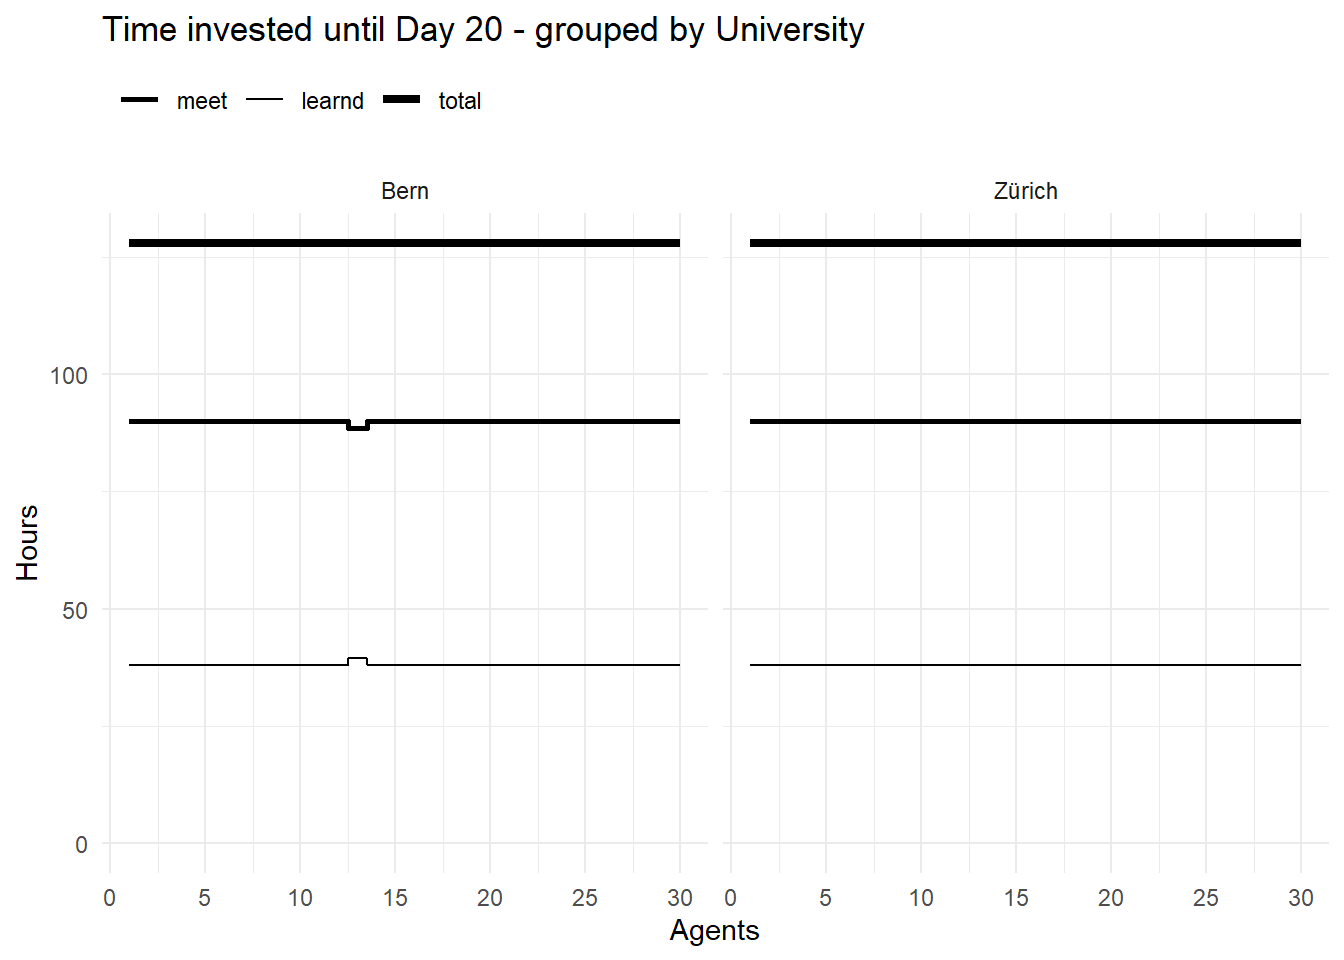
plt_Time_invest(TL =res$TL, TP =20, Group ="ID_University")
Code
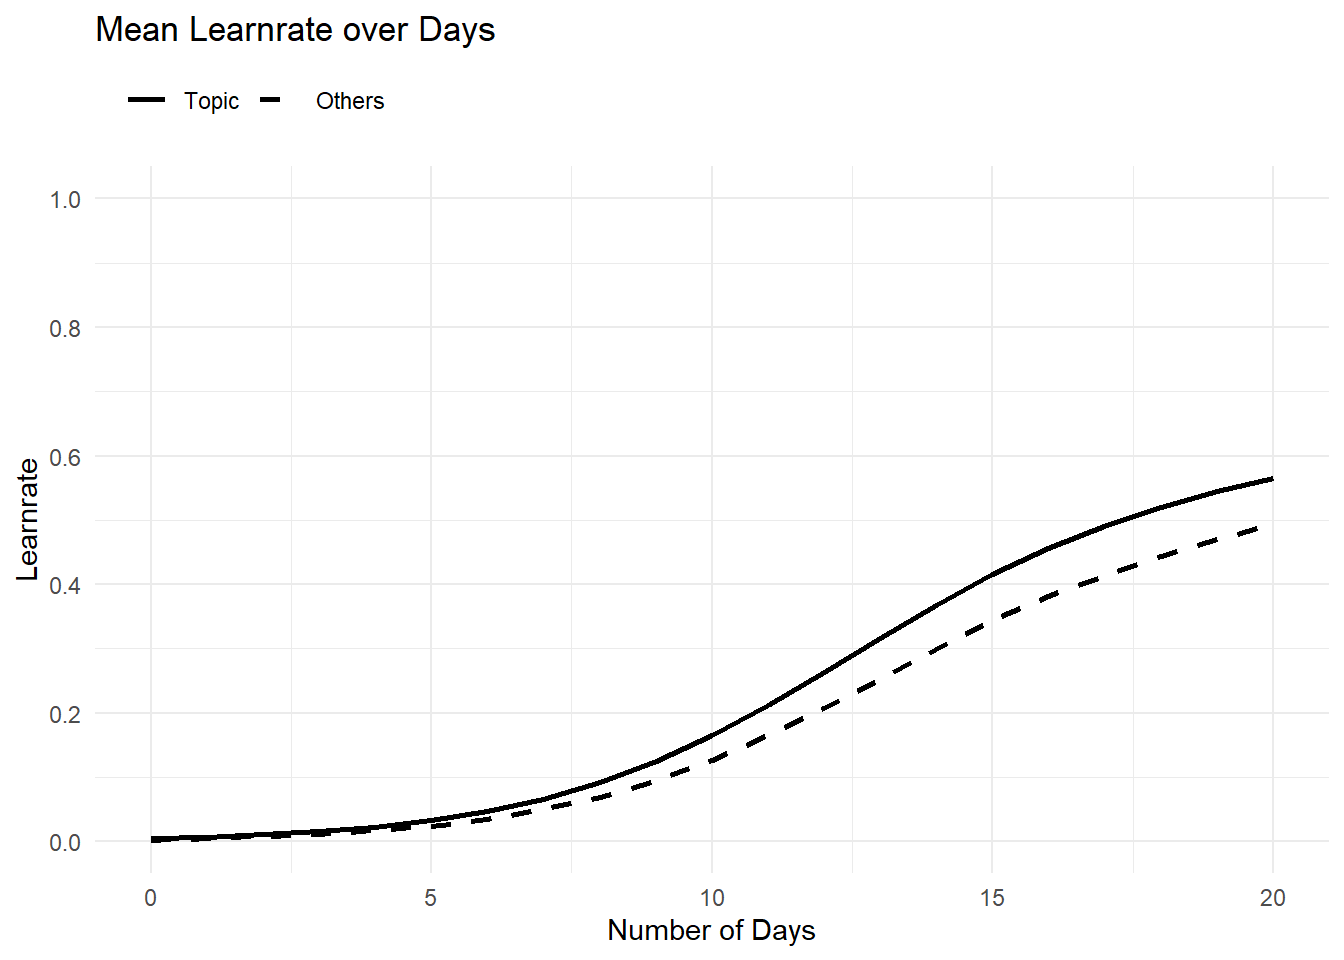
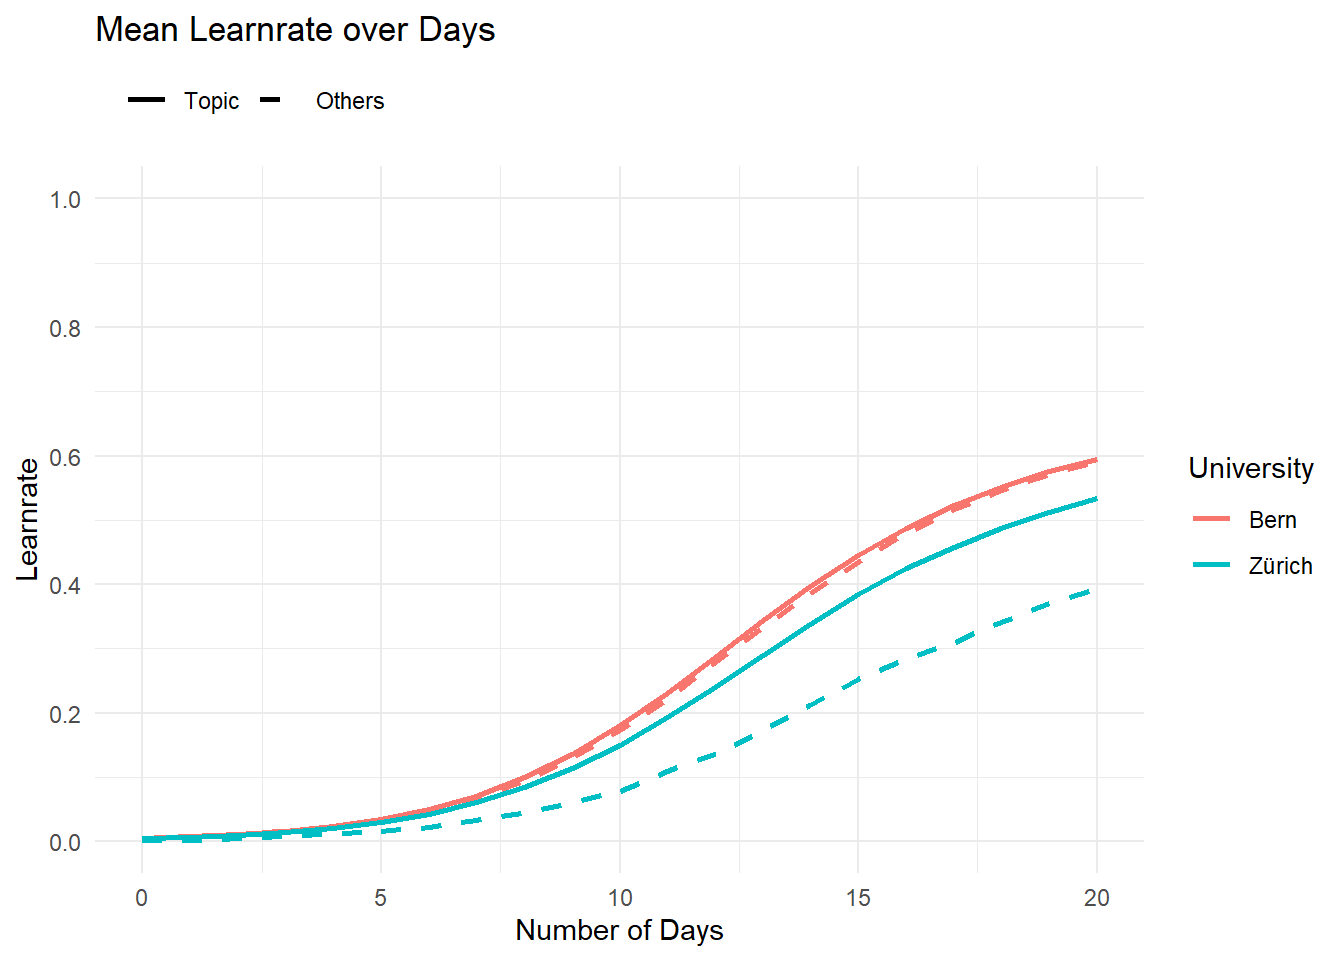
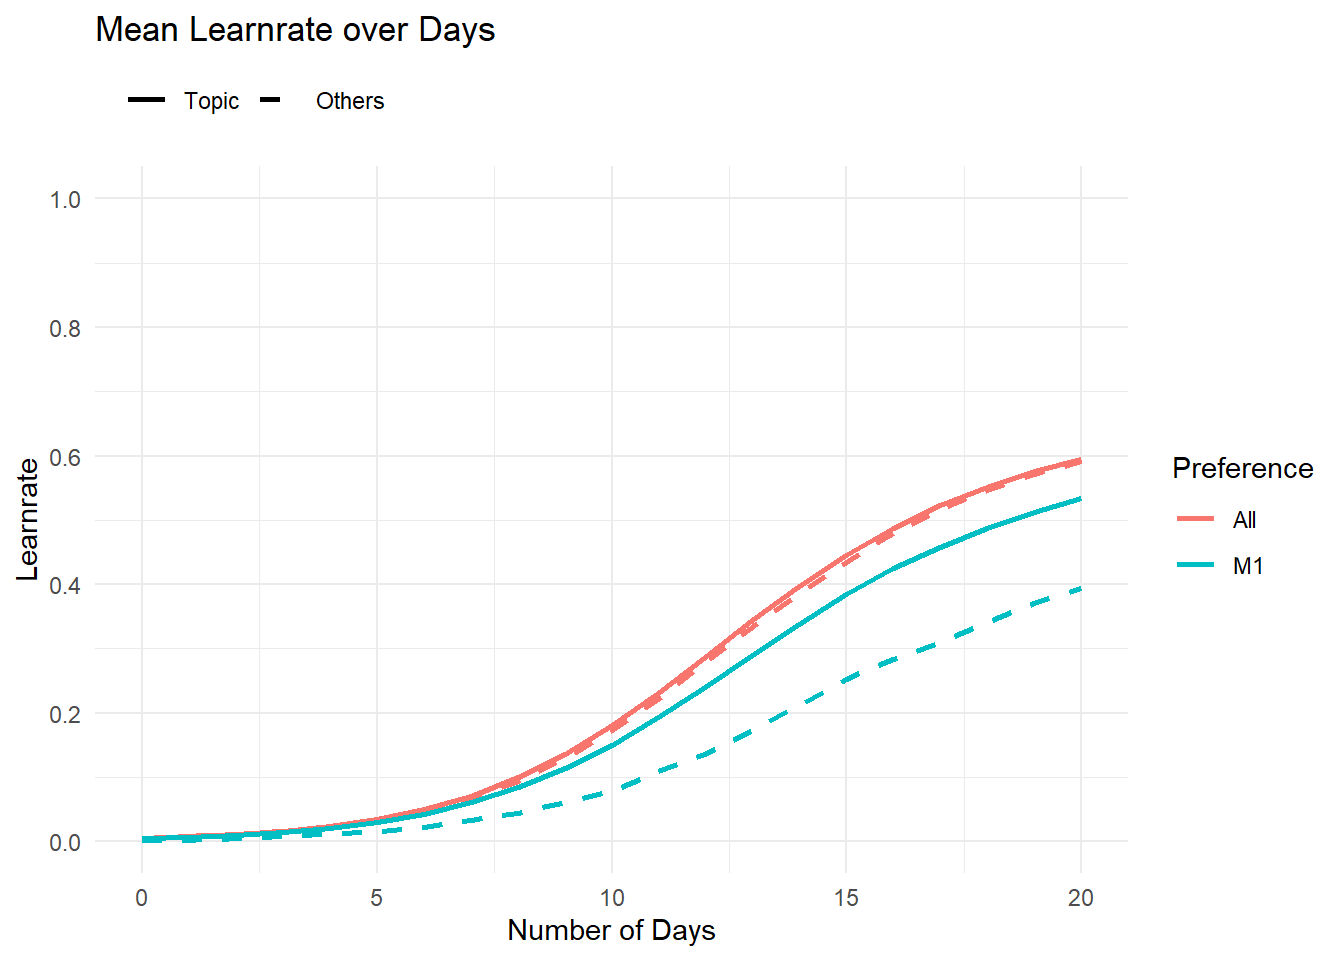
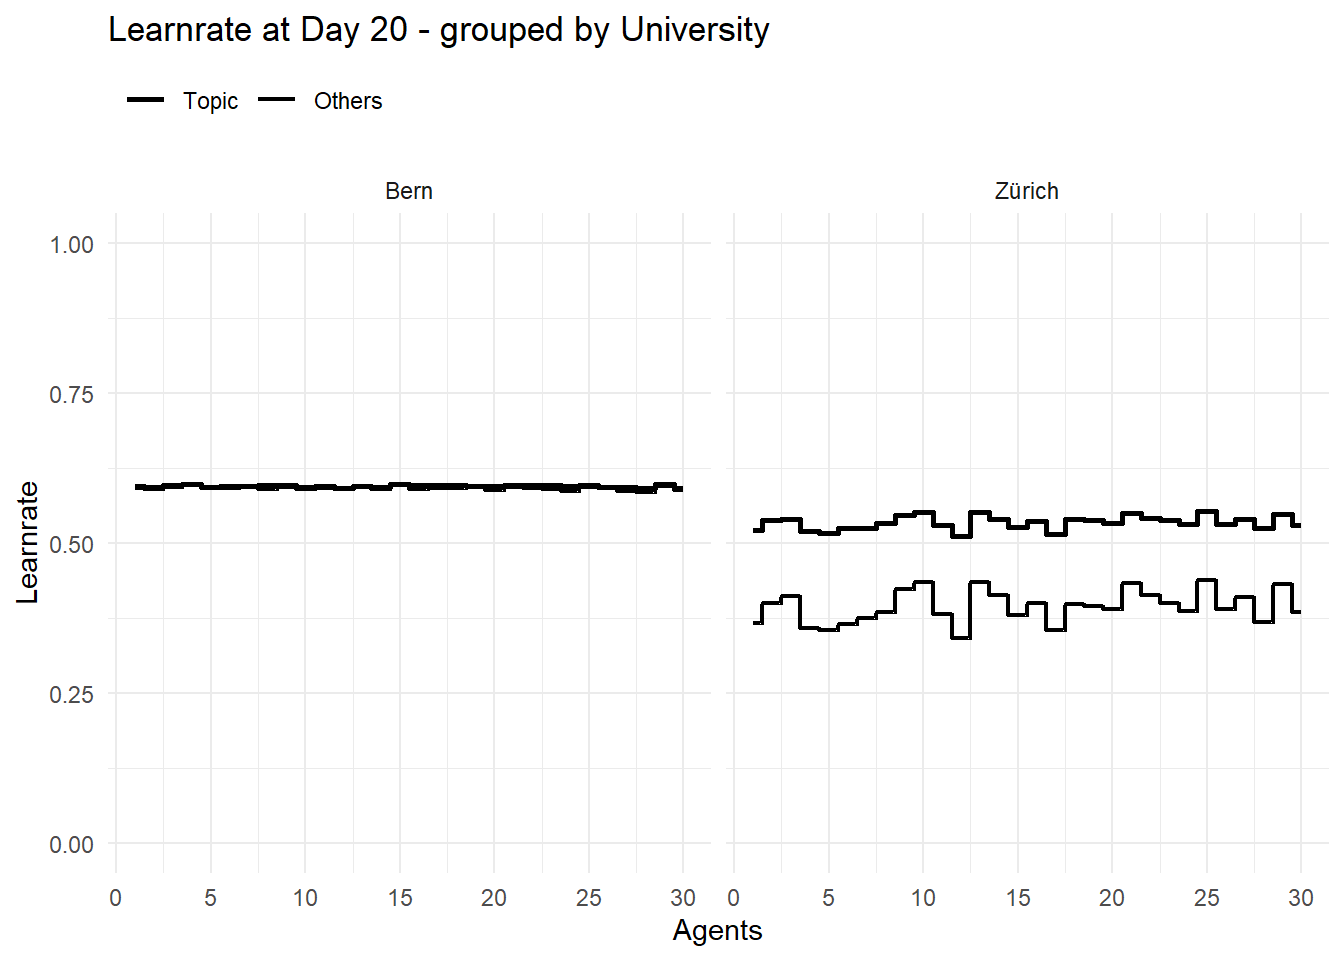
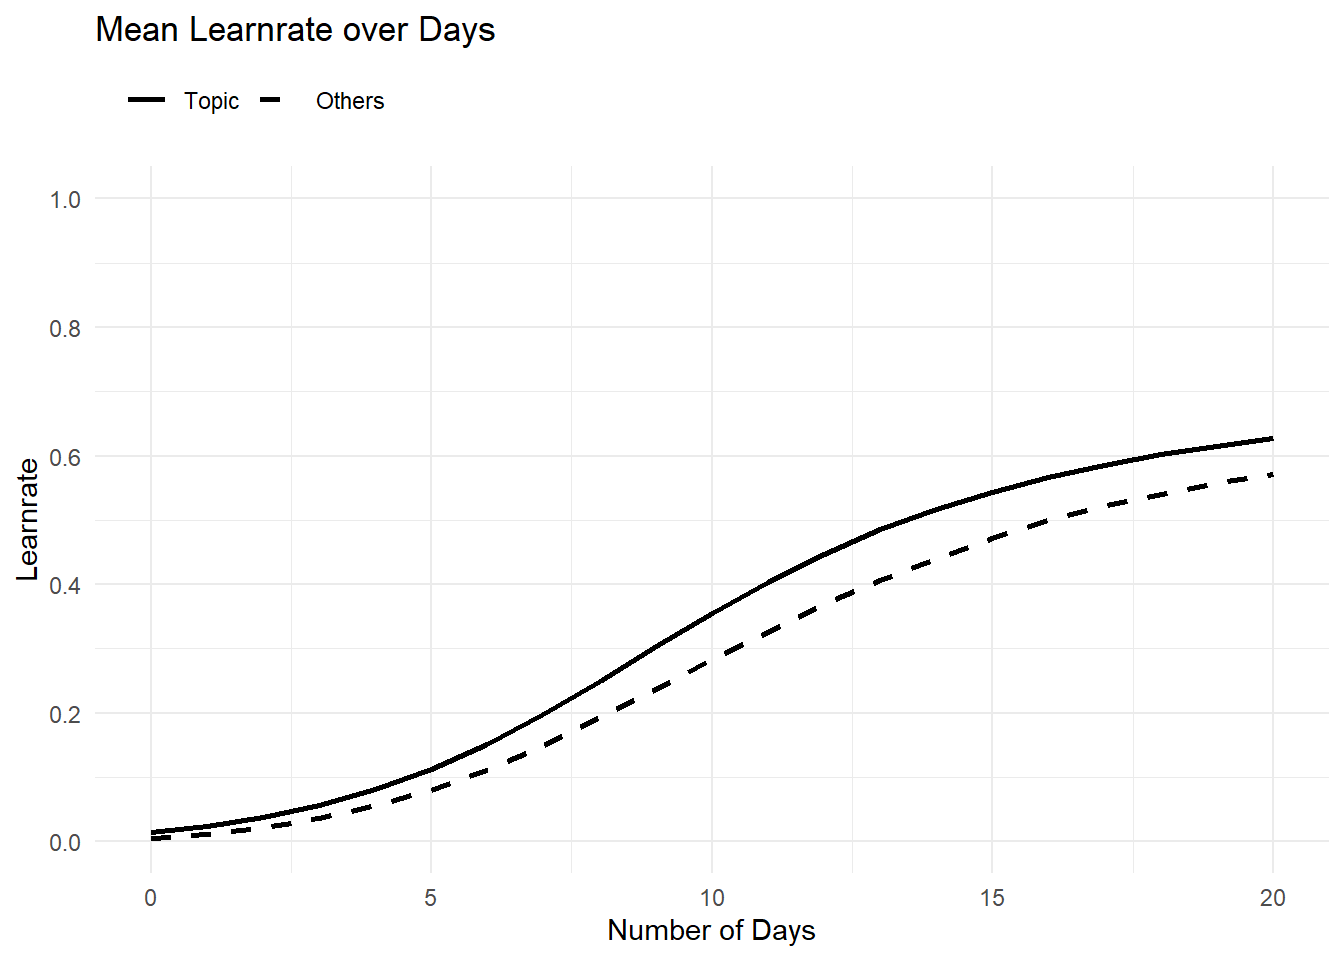
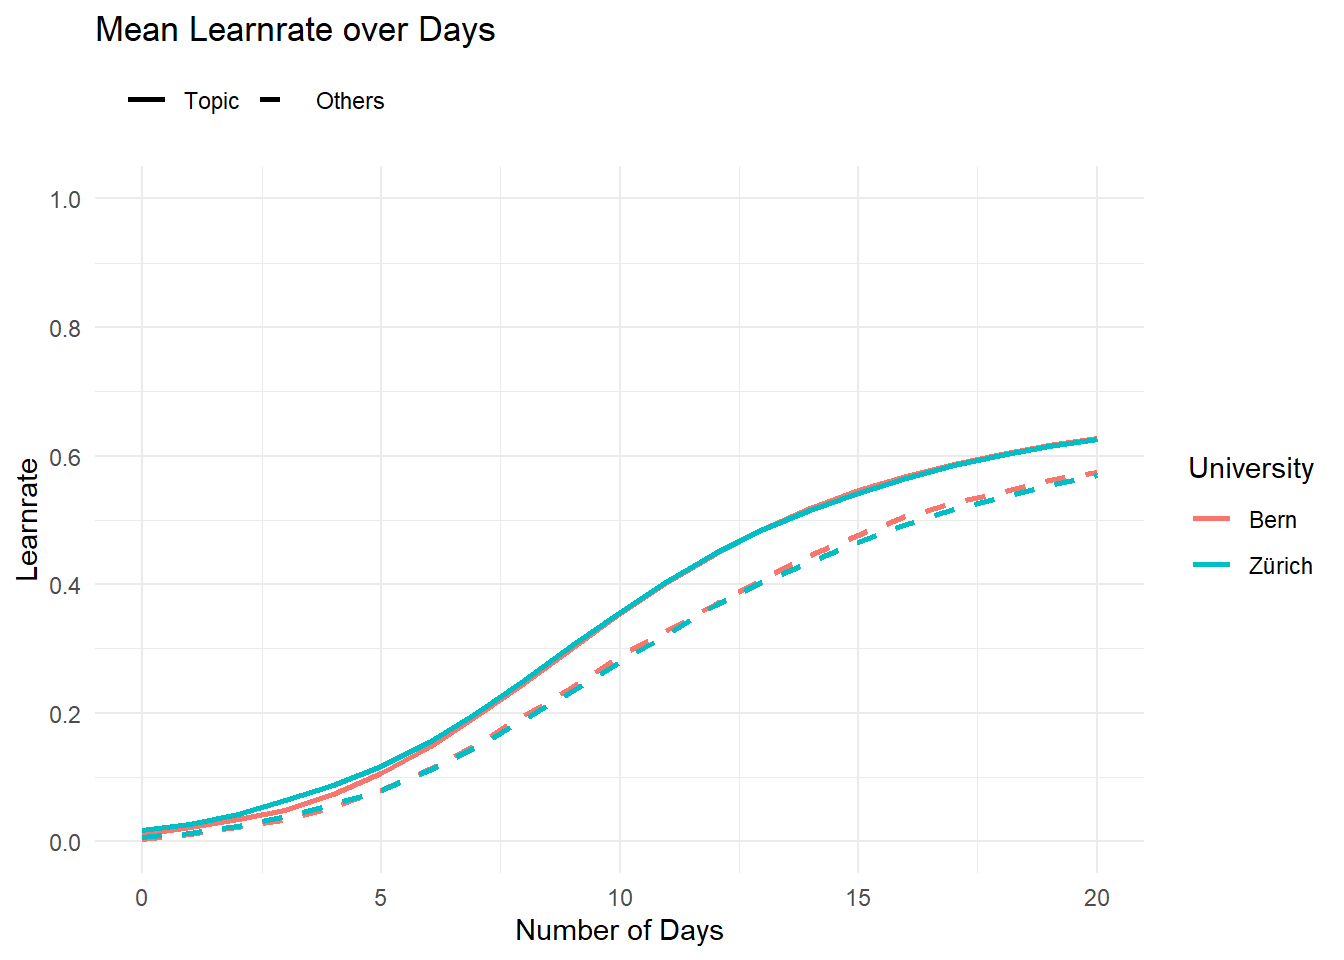
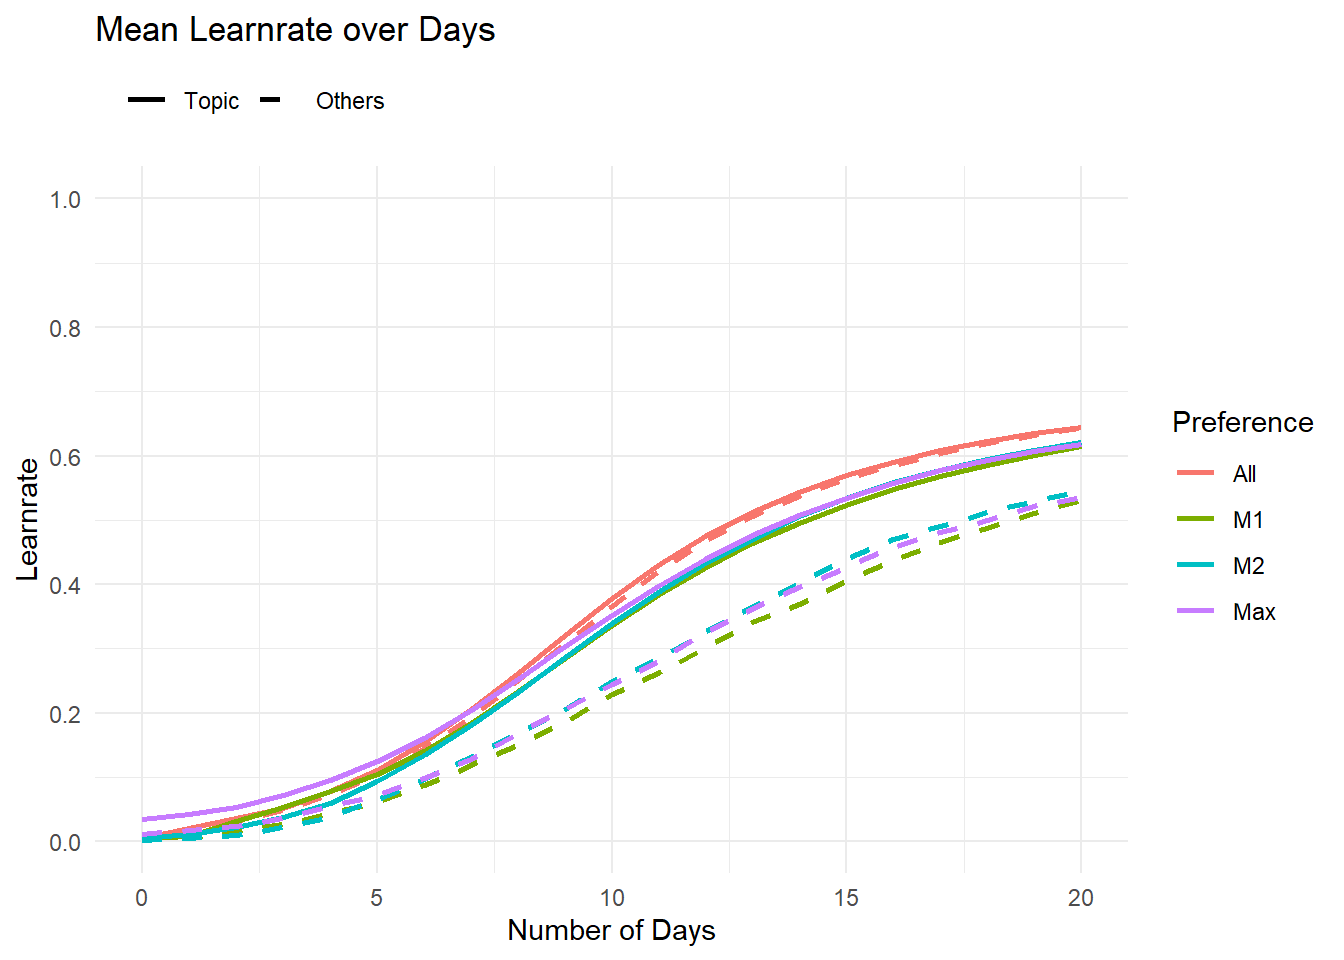
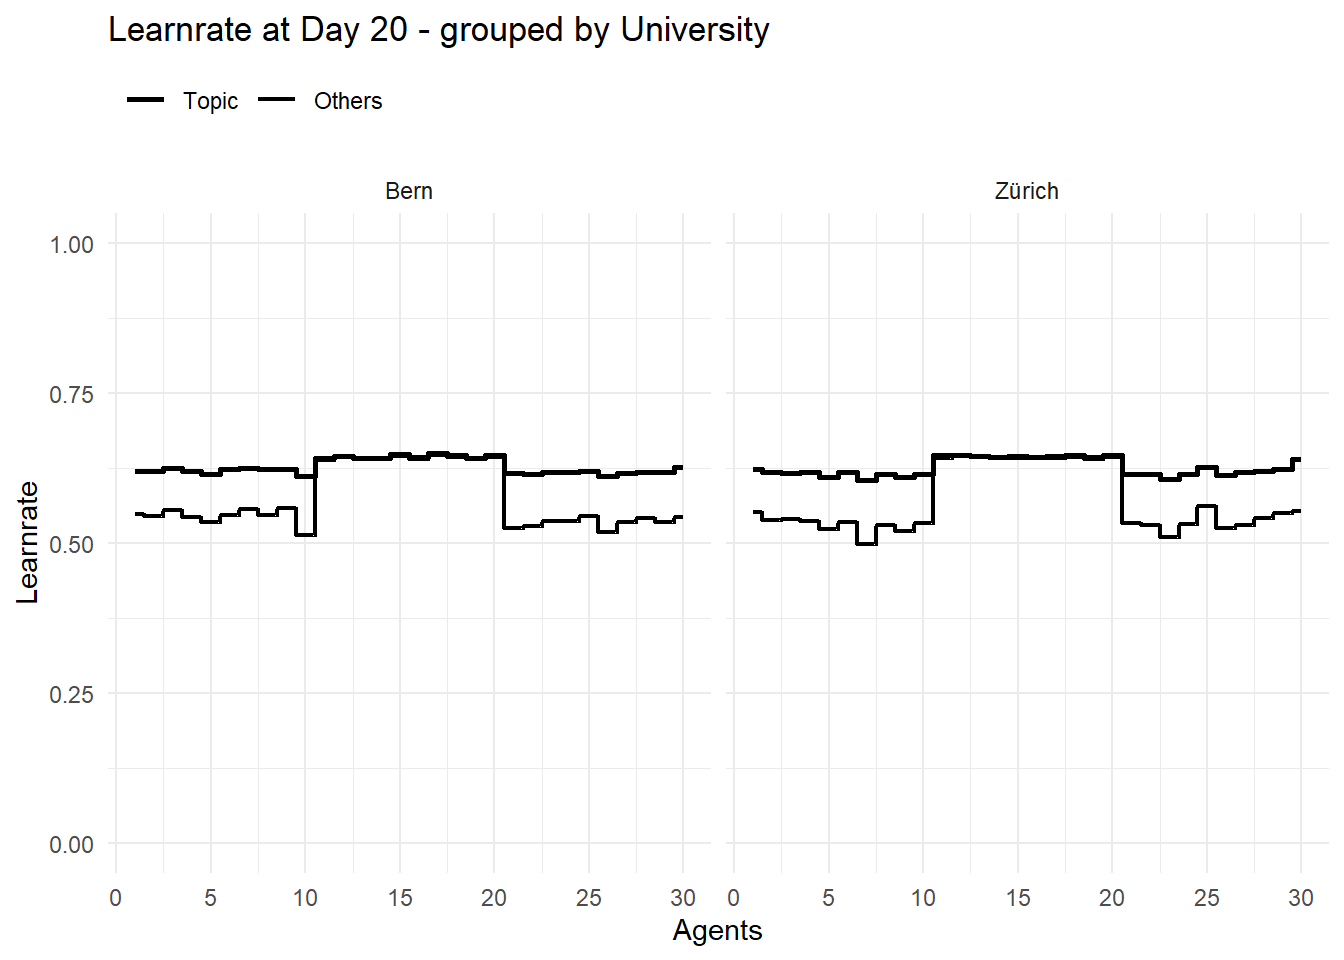
plt_Learnrate_Time(TL =res$TL, TP =20, Group ="ID_University")
Code
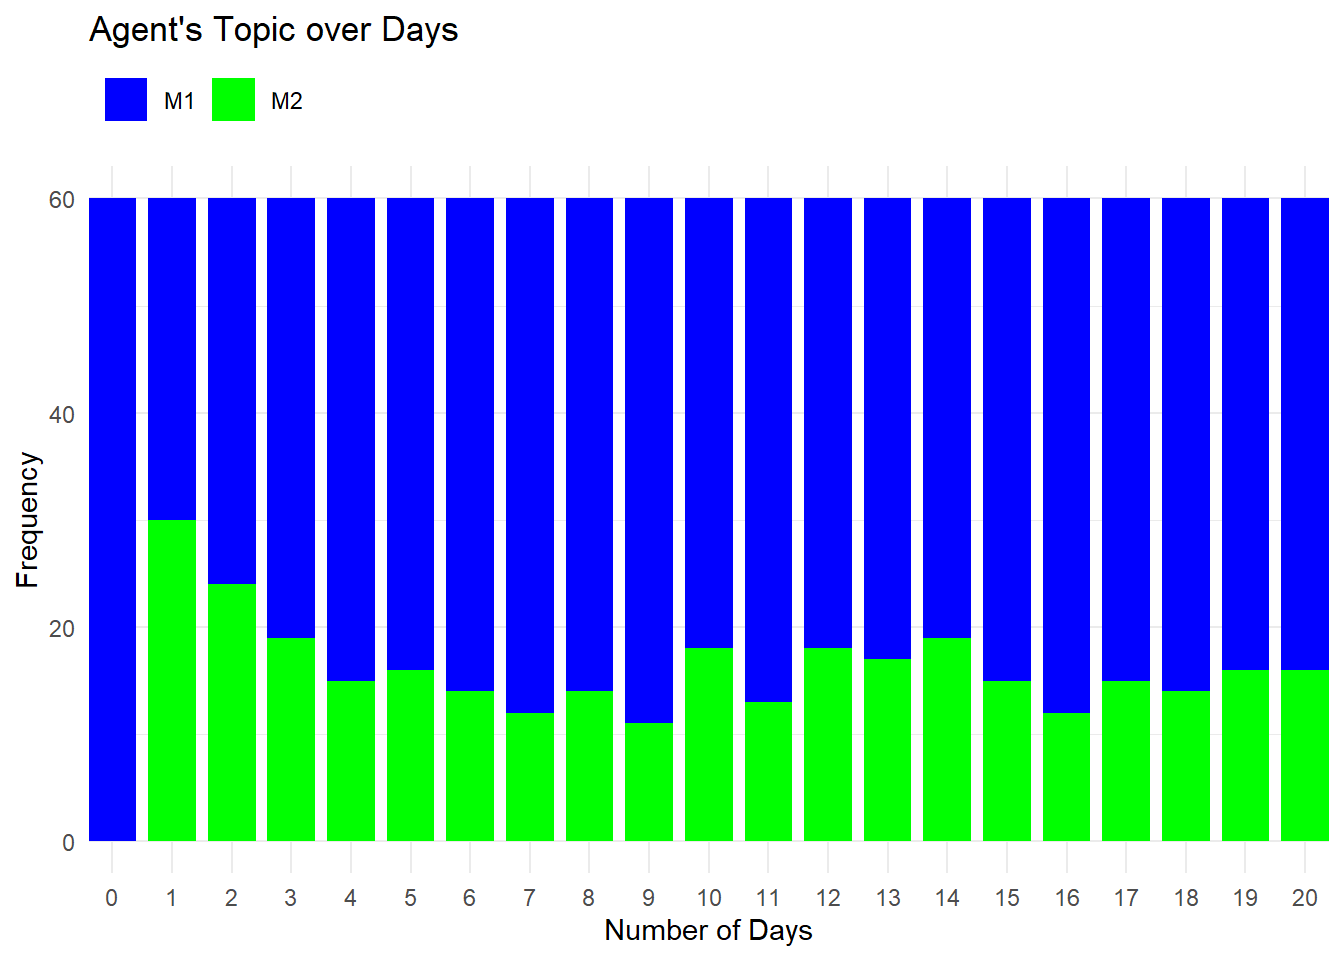
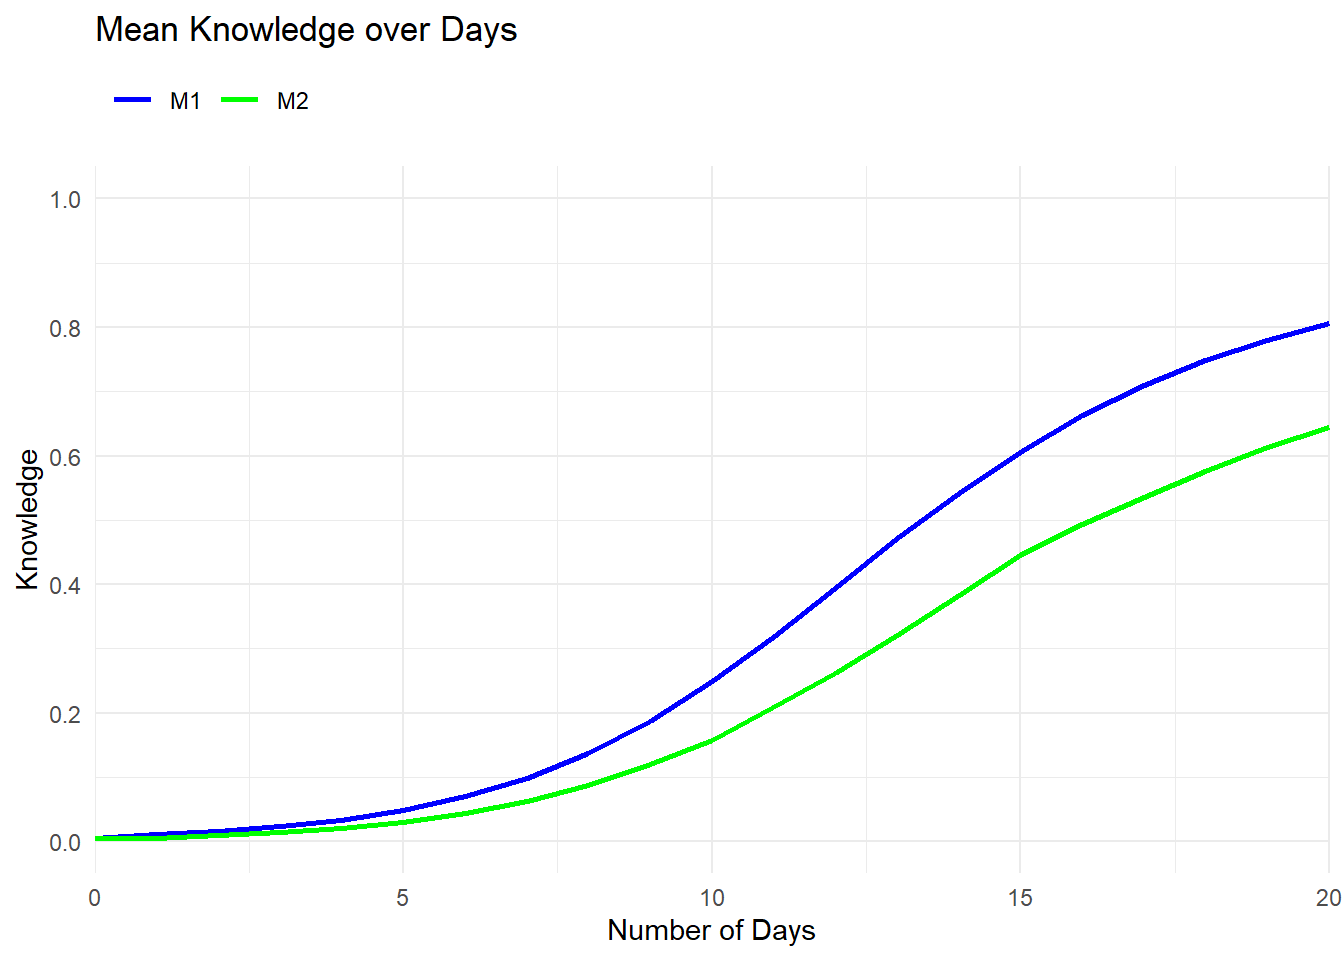
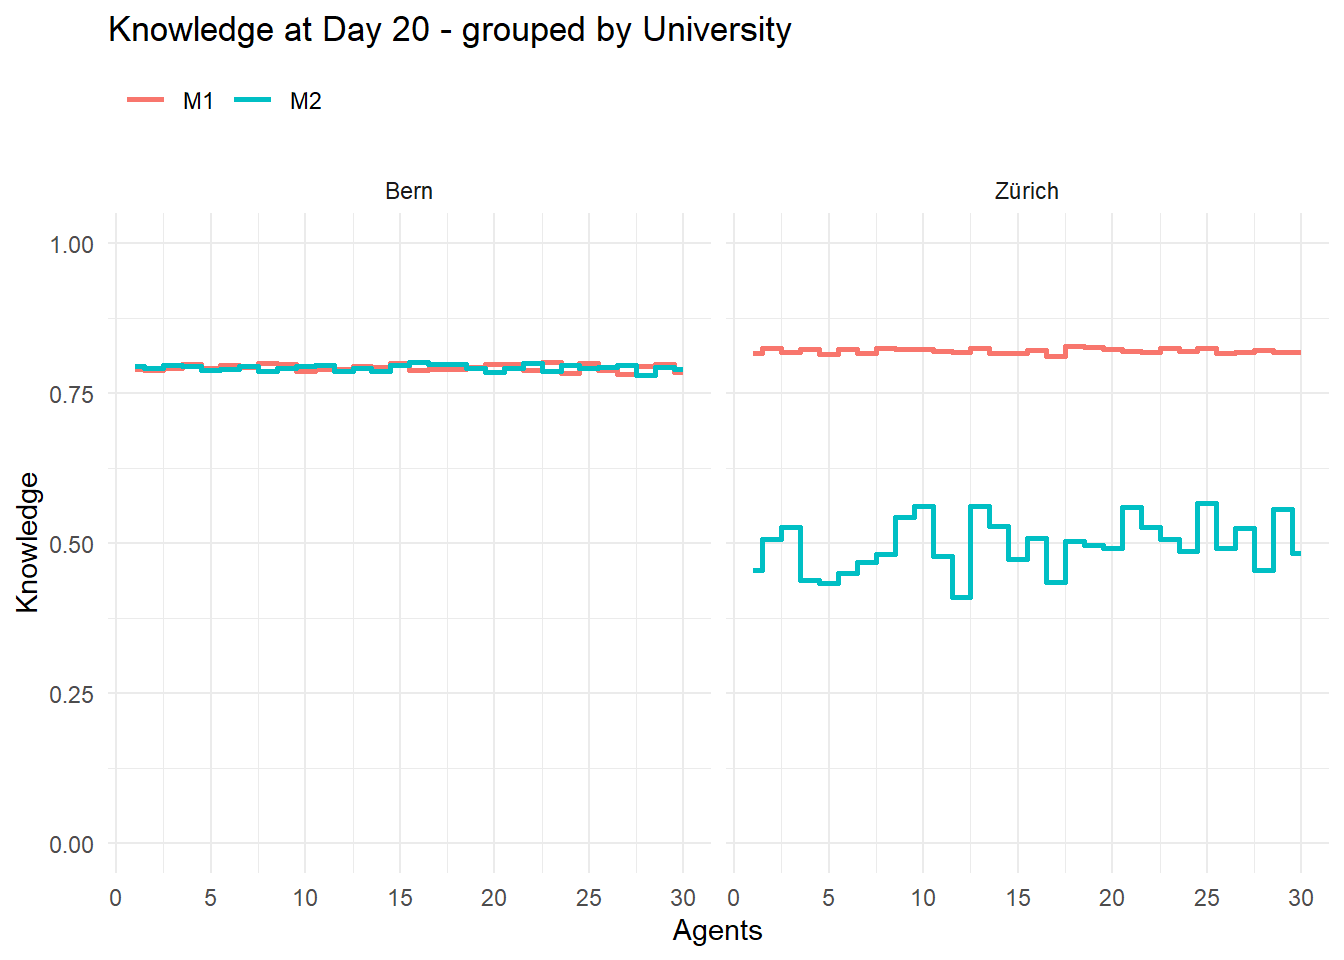
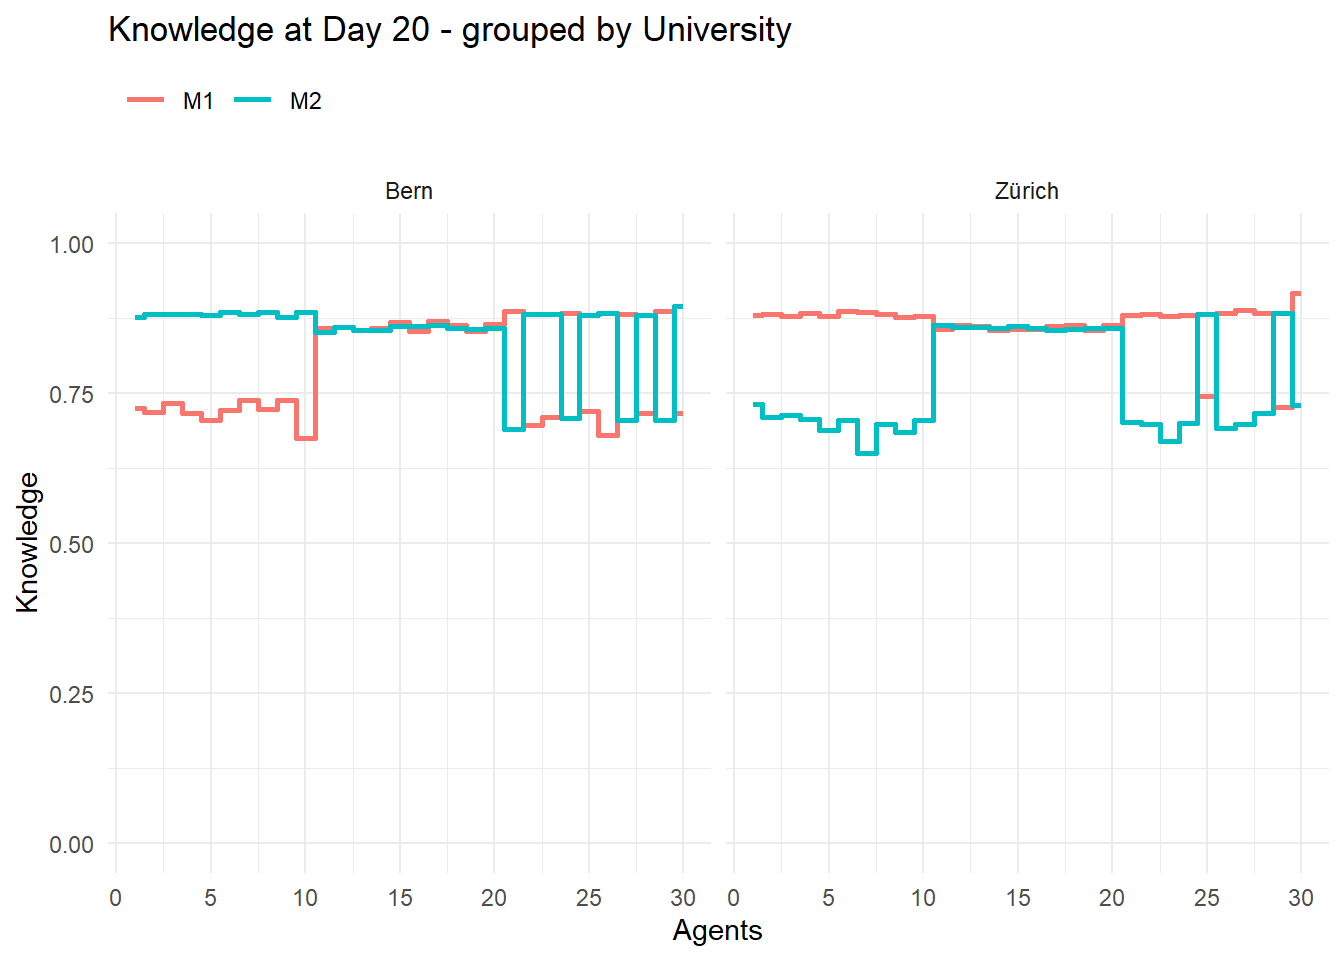
plt_Knowledge_Time(TL =res$TL, TP =20, Group ="ID_University")
Special Cases
Only one Agent with Knowledge (0.8)
Code
Pop<-gen_Pop( nA =10, ID_Preference ="M1", ID_University ="Zürich", K =list(0.01), Typ =list("M1"), pWD =0.8, pMD =0.8)Pop<-gen_Pop( addToPop =Pop, nA =10, ID_Preference ="All", ID_University ="Zürich", K =list(0.01), Typ =list("M1"), pWD =0.8, pMD =0.8)Pop<-gen_Pop( addToPop =Pop, nA =9, ID_University ="Zürich", K =list(0.01), Typ =list("M1"), pWD =0.8, pMD =0.8)Pop<-gen_Pop( addToPop =Pop, nA =1, ID_University ="Zürich", K =list(0.8), Typ =list("M1"), pWD =0.8, pMD =0.8)Pop<-gen_Pop( addToPop =Pop, nA =10, ID_Preference ="M2", ID_University ="Bern", K =list(0.01), Typ =list("M2"), pWD =0.8, pMD =0.8)Pop<-gen_Pop( addToPop =Pop, nA =10, ID_Preference ="All", ID_University ="Bern", K =list(0.01), Typ =list("M2"), pWD =0.8, pMD =0.8)Pop<-gen_Pop( addToPop =Pop, nA =9, ID_University ="Bern", K =list(0.01), Typ =list("M2"), pWD =0.8, pMD =0.8)Pop<-gen_Pop( addToPop =Pop, nA =1, ID_University ="Bern", K =list(0.4), Typ =list("M2"), pWD =0.8, pMD =0.8)Pop